

Chart Statistics
Overview of Chart Statistics
The Chart Statistics function allows you to integrate statistical information within the plot area of a chart. Grid values are represented by the chart, while the statistical values are portrayed using additional lines.
- Each series in the chart can be assigned up to three statistical measures.
- Standard Deviation
- Average
- Median
- Once a statistical measure has been created, it can be customized in terms of line type, line color and line thickness.
Adding Built-In Chart Statistics
Click the Data Discovery/Analysis/Chart Statistics button to display the command list.
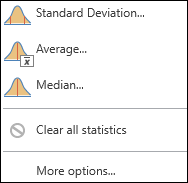
Choose one of the three built-in options for quick display of chart statistics:
- Standard Deviation
- Average
- Median
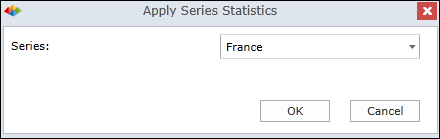
Choose the desired series:
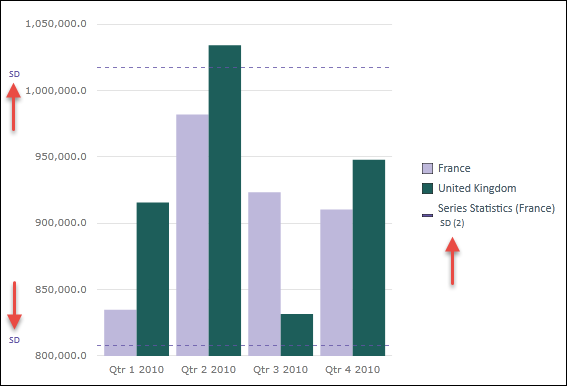
Standard Deviation
Shows the standard deviation range for the selected series, as shown below. Two lines indicate the top/bottom ranges for standard deviation.
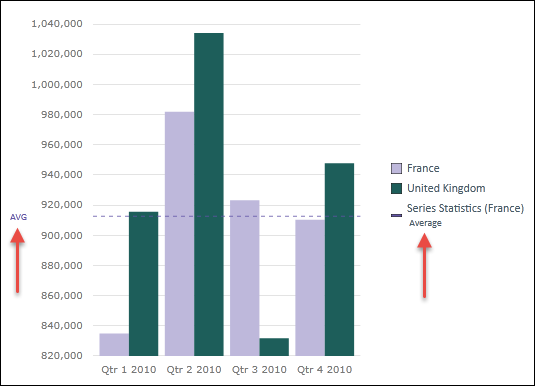
Average
Shows the average value for the selected series, as shown below.
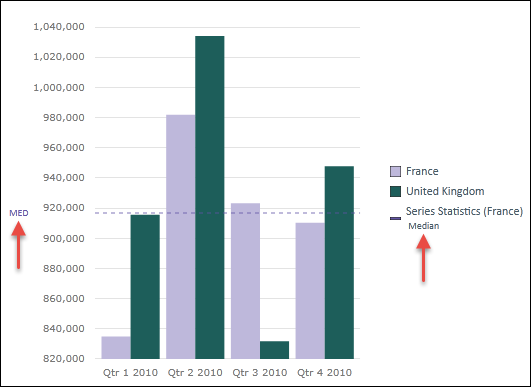
Median
Shows the median value for the selected series, as shown below.
Combining Chart Statistics
To combine more than one type of statistics for a single series, select More Options.
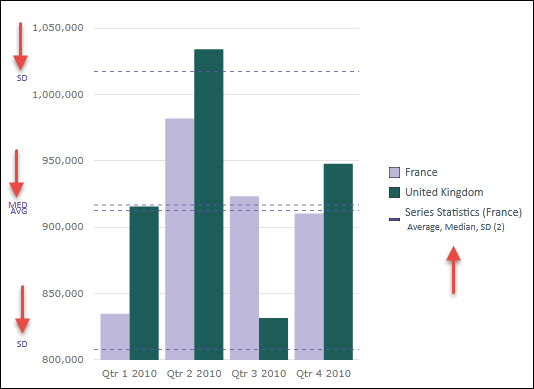
Select any combination of the three built-in statistical options. In this example, we have selected all three options.
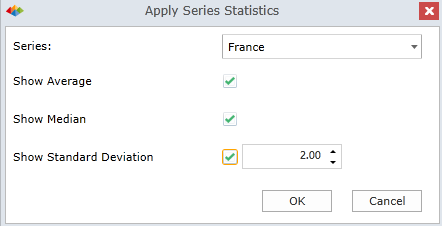
Click OK to display lines.
Customizing a Chart Statistics Series
Right-click a series name in the legend to access series commands.
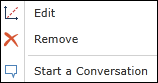
Click Edit to open the Series Editing dialog.
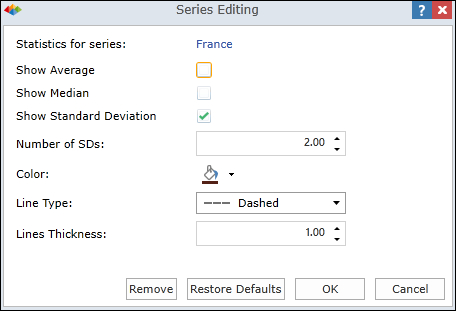
Use this dialog to customize the chart statistics displayed for the series:
Show Average - Turn on/off.
Show Median - Turn on/off.
Show Standard Deviation - Turn on/off.
Number of SDs - The calculation factor for computing standard deviation. Can be greater than 0.10 or greater.
Color - Choose a line color.
Line Type - Choose a line type (Solid, Dashed, Dotted).
Line Thickness - Choose desired line thickness.
Removing All Chart Statistics
Click Clear all statistics to remove all chart statistics from the query.
Home |
Table of Contents |
Index |
User Community
Pyramid Analytics © 2011-2022